Net Migration by Decade, 1950-2020
From 2010 through 2019, an average of 17.5 million Americans—five to six percent of the population—moved to a different county annually. Migration rates vary by age, race, and ethnicity and with local and national social and economic conditions over time. Nonetheless, individual counties' patterns of age-specific migration tend to be consistent over time, telling demographic stories about local places. This website highlights these stories by providing reliable estimates of net migration broken down by age, race, Hispanic origin, and sex for all U.S. counties and states each decade from 1950 to 2020.
Click the tabs above to make maps and charts that allow you to visualize migration patterns. Charts make it easy to compare migration patterns over time within a single county or to compare patterns in two or three different counties. Maps show how counties across the country compare to one another. The data download tab allows you to download migration data as well as Census data for your own analysis.
We hope you'll find this website useful. Please contact us with any questions or comments.
Learn more about these data and the methods used to generate them.
Suggested Citation:
Egan-Robertson, David, Katherine J. Curtis, Richelle L. Winkler, Kenneth M. Johnson, and Caitlin Bourbeau, Age-Specific Net Migration Estimates for US Counties, 1950-2020. Applied Population Laboratory, University of Wisconsin - Madison, 2024. Web. [Date of access.] https://netmigration.wisc.edu/.
Sponsorship
Support for the generation of these data has come from various sources and institutions over the last 70 years. The 2010-2020 project, including construction of this website, was supported by Grant Number 1R03HD100772-01 from the Eunice Kennedy Shriver National Institute of Child Health and Human Development and by the U.S. Department of Agriculture, Economic Research Service, Cooperative Agreement No. 58-6000-9-0043. The content is solely the responsibility of the authors and does not necessarily represent the official views of the Eunice Kennedy Shriver National Institute of Child Health and Human Development, the National Institutes of Health, or the United States Department of Agriculture.
Work on the current project was conducted at the Applied Population Laboratory at the University of Wisconsin- Madison, the Department of Social Sciences at Michigan Technological University and the Carsey Institute at the University of New Hampshire.
Contact
Please contact Raeven Chandler at the Applied Population Laboratory with questions or comments about the data, any technical difficulties you may encounter, or to provide suggestions for improving this website.


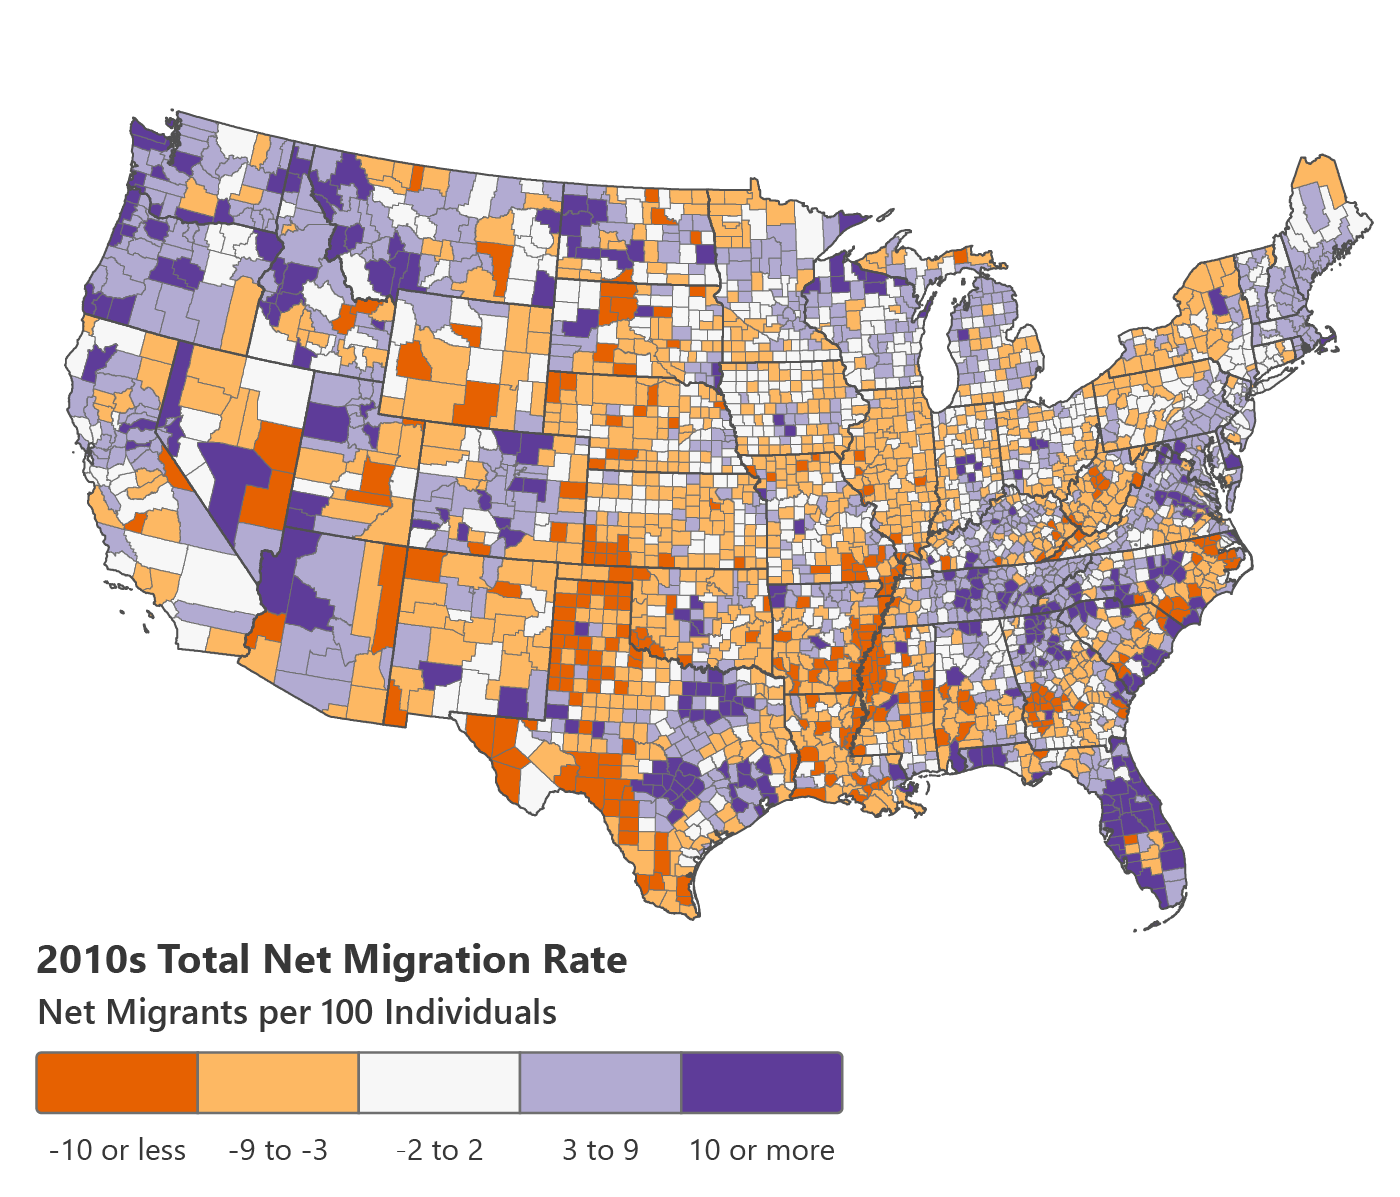
Net Migration by County
2010s Total Net Migration Rate
Net Migrants per 100 Individuals
Map Downloads
Zoom Tools
Selected Counties
To select a county, double-click on the map.
- Selection: none
- Selection: none
- Selection: none
Select Counties *Please select at least one county
Note: Charts combine some counties into groupings where boundaries have changed over the decades. Other counties are missing data from prior decades. A summary of the counties affected by these boundary changes is available.
Net Migration by Age
Egan-Robertson, David, Katherine J. Curtis, Richelle L. Winkler, Kenneth M. Johnson, and Caitlin Bourbeau, Age-Specific Net Migration Estimates for US Counties, 1950-2020. Applied Population Laboratory, University of Wisconsin - Madison, 2024. Web.
Download custom datasets using the options below. To simply download the full dataset for the 2010s instead, see Other Downloads.
Select Geography *Please add at least one geography
Your Selections
Geography Selections *Please add at least one geography
- no selections yet
Decade and Characteristics Selections *Please add at least one combination of decade, race/ethnicity, and sex
- no selections yet
Other Data Selections
- no selections yet